In an effort to visualize Ontario’s impact across the United States, the University of Toronto’s Munk School of Global Affairs, in collaboration with the Government of Ontario, has developed an interactive map showing how Ontario-based businesses are spread across America.
“We are pleased to have worked with the Government of Ontario on this timely and important project,” says Randall Hansen, interim director of the Munk School.
The map, developed by Deanna Horton, fellow at the Munk School, with research assistance from Munk School and U of T students, is fashioned after similar projects like the CanAsia Footprint map which illustrates Canada’s trade relationship with Asia.
“The map tells a story about the integration of Ontario companies into local economies,” says Horton. “If a small business is interested in the U.S. market and wants to know who else in the sector has established a presence, the map is available for consultation 24/7. If banks or service businesses are interested in potential Canadian clients in the U.S., they can use this map to find them. It’s also helpful for job-seekers.”
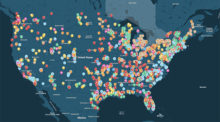
The map uses colour-coded points to represent subsidiaries of Ontario companies in eight sectors:
- agriculture/fish/food
- automotive/defence/aerospace
- financial/business services/energy/extractive/environment
- information/communication technology
- infrastructure/engineering/ transport/construction
- manufacturing
- other services
Users can search the map by state, congressional district or by company name and see at a glance how densely Ontario businesses populate any given area. Horton says it’s a valuable resource for governments in Canada and the USA in light of the current North American Free Trade (NAFTA) renegotiations.
“Since the NAFTA came into effect, companies from Ontario have been taking advantage of the larger U.S. market. Not only manufacturing but also services and tech-related firms. And not just for large companies — small and medium-sized enterprises (SMEs) represent almost three-quarters of all locations on the map. SMEs are the bedrock of Canadian communities and this pattern is repeated in the U.S.,” says Horton.
While the federal government is the lead on NAFTA renegotiation, the Government of Ontario has also been active at the state and local level to emphasize the importance of open borders to North America’s well-being. For example, Ontario Premier Kathleen Wynne’s government successfully negotiated with New York State to neutralize “Buy American” policies that could have negatively impacted Ontario.
“When states and local governments are under pressure to institute ‘Buy American’ regulations, the map is a tool to fight back. When members of the U.S. Senate and House of Representatives are considering legislation that would be potentially harmful to Canadian interests, the map is a reminder of Ontario’s footprint,” says Horton.
September 20, 2017